1. Start the subregulator.m Matlab process under ordinary Matlab on the Linux machine.
2. Start the regulator.m Matlab process under Matlab with real time extensions (procmatlab) on the Linux machine.
3. Start the ProcGUI.class Java program on the Windows NT machine either by going back to the main page and select "The Java GUI" or by running the class from Symantec Visual Cafe.
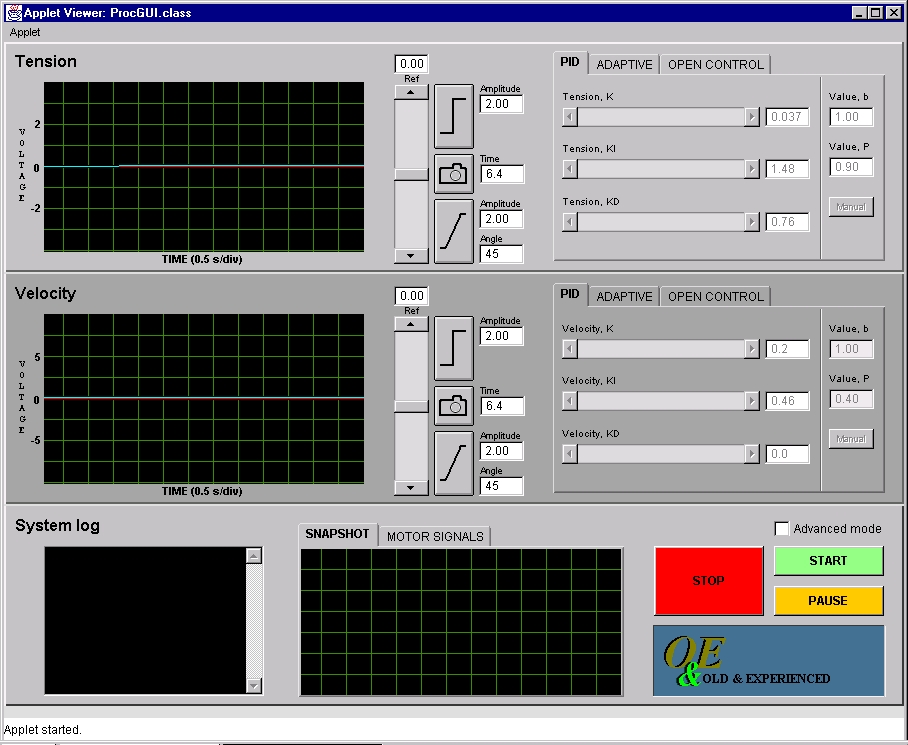
When the system starts up the default regulator started is the PID for both tension and velocity. See figure below for an illustration of how the system looks just after startup.
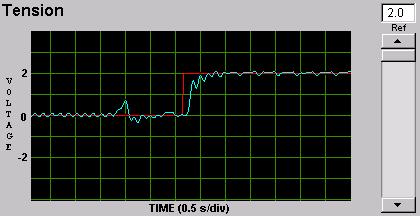
1. The reference signals for tension and velocity can be altered separately by moving the appropriate slidebar or typing in a value as can be seen in the figure below.
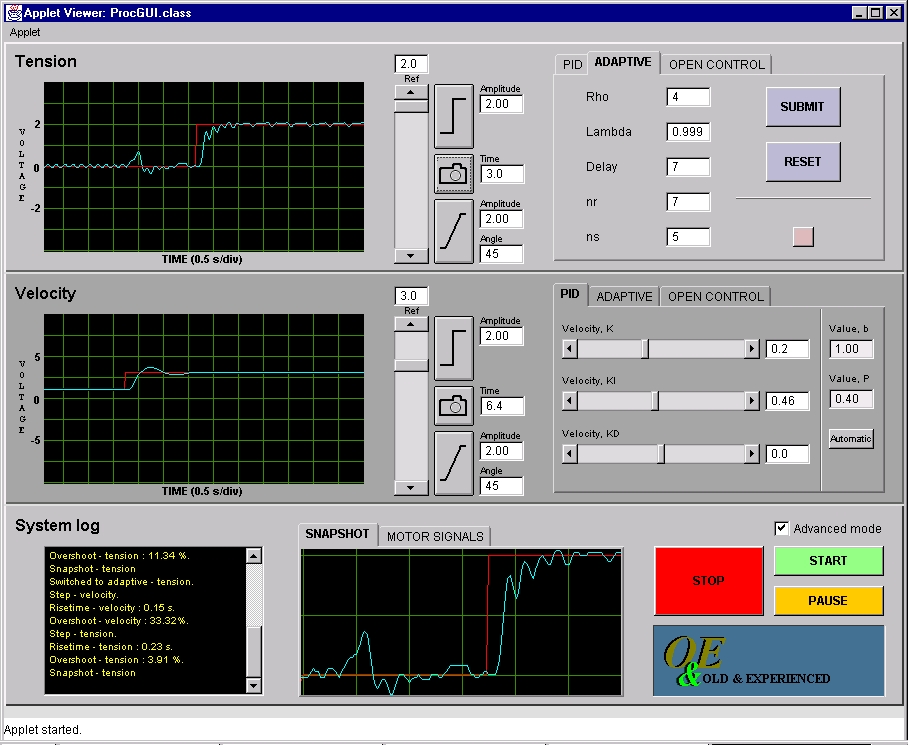
2. Regulators can be changed separately for the tension and velocity by clicking on the appropriate tab on the panel as can be seen the figure below.

3. A step can be performed for either the tension or the velocity by pressing a button. The height for a step can be filled in next to the button as seen in the figure below.

If the amplitude of the step is too large the step will be halted at the maximum (or minimum) voltage.
4. A ramp can be performed for either the tension or the velocity by pressing a button. The height and slope for a ramp can be filled in next to the button as seen in the figure below.

If the amplitude of the ramp is too large the ramp will be halted at the maximum (or minimum) voltage.
5. A snapshot of the tension or the velocity graph can be taken for a user defined period of time. The period may however not be greater than one full screen width (6.4 seconds) since no more values are buffered. This snapshot is presented on a seperate display as seen in the figure below.
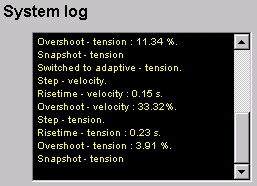
6. The status window can be scrolled back if the user wishes to check the complete history of the process as can be seen in the figure below.
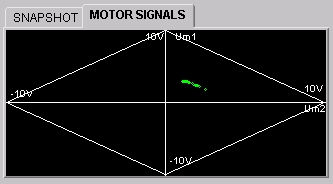
7. In the mid bottom of the screen, in the tab panel, a choice can be made between plotting the motor signals (U1 and U2) or the latest snapshot taken. When one of the snapshot buttons is pressed this tab panel is automatically switched to showing the snapshot. See the figure below for a picture of the motor signal plot.
8. The user can choose to stop, pause or start the process by pressing the buttons in the lower right corner as can be seen in the figure below.

9. The logotype in the lower right corner of the GUI has no special purpose but you can see it in the figure below.


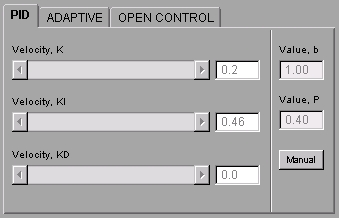
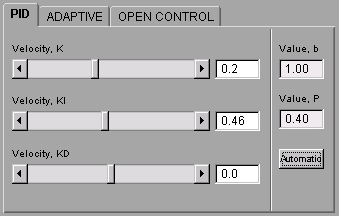
1. In the PID panel, the following values can be set: K, KI, KD, P and b. See the figure below for an example of this.Note that PID mode has to be set to MANUAL to be able to choose parameters of your own, otherwise the PID regulator is running our well trimmed AUTOMATIC regulator.
 |
 |
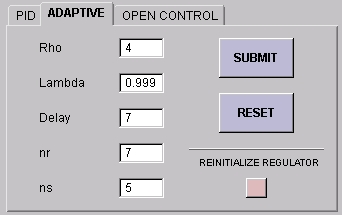
2. In the adaptive control panel, the following values can be set: rho, lambda, delay and polynomial orders. See the figure below for an example of this. If you want to make a change in these values you first type the values in their box and then push the SUBMIT button to make the regulator adapt the new values. In case of a simple change in rho or lambda the regulator changes immediatly, otherwise the Matlab subprocess first adapts a new regulator before submitting it to be the main regulator. The RESET button instantaniously resets the adaptive regulator to its default values. The REINITIALIZE REGULATOR button reinitializes the history of the regulator, which can be useful if for some reason some unwanted dynamics are adapted into the regulator.
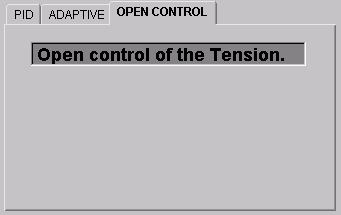
3. In the open control panel, no values can be set as can be seen the figure below.
1. Press the STOP button in the Java GUI to terminate the main Matlab process regulator.m.
2. Halt the subregulator process by pressing CTRL+C in the appropriate terminal window on the Matlab side.
3. Exit the Java GUI interface.
