


Next: About this document ...
EXPERIMENT 1.
NOISE FIGURE MEASUREMENTS
MIXER CHARACTERISTICS
(1.1) Noise Figure Measurements:
In the first part of this experiment we study the noise performance
of microwave devices. The importance of noise stems from the fact that microwave devices internally generate
noise and signal power to be handled by the system is usually weak. If noise is not controlled it causes undesirable performance of
the communication system. Noise figure is a quality factor which
describes the above property of the device and it is an important
parameter of interest for selecting the device for a particular
application. In this experiment we measure noise figure of the given
components and verify some fundamental formulas concerning Noise
Figure.
Figure 1:
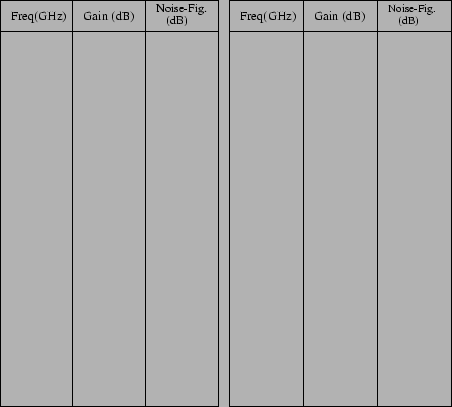 |
1.1-A) Given a calibrated Noise Figure meter (HP-8970A). Measure the
gain and Noise Figure of the given amplifier as a function of
frequency from 10-1500 MHz.
1.1-B) Measure the Gain and and Noise Figure of the given Attenuator at 900 MHz.
Noise Figure(F1)=-------dB., Gain(G1)=--------dB.
1.1-C) Measure the Gain and and Noise Figure of the given Amplifier
(MiniCircuits, ZFL 2000) at 900 MHz after biasing the amplifier
according to specifications.
Noise Figure(F2)=-------dB., Gain(G2)=--------dB.
Figure 2:
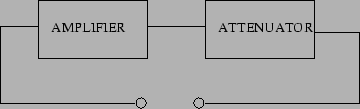 |
1.1-D) Connect the attenuator and amplifier of 1.1-A and 1.1-B in
cascade as shown in Fig.2 and measure the Noise Figure and Gain of the
complete system.
Noise Figure( )=--------dB, Gain(
 )=--------dB.
Figure 3:
Waveguide connected with load and source.
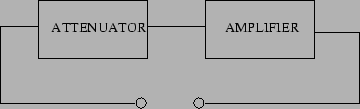 |
1.1-E) Interchange the attenuator and amplifier of 1.1-D as shown
in Fig.3 and repeat the measurements.
Noise Figure( )=--------dB, Gain(
 )=--------dB.
Answer the following questions
a) Find the theoretical Gain and Noise Figure of 1.1-D and 1.1-E)
using the formula for Noise figure of cascaded systems and results of
1.1-B and 1.1-C.
b) Write your conclusion from 1.1-D and 1.1-E.
c) Choose from the following the circuit for best performance. Write the reason for your choice.
i) Antenna-Amplifier-CoaxialCable-TV.
ii) Antenna-CoaxialCable-Amplifier-TV.
d) What are the causes of noise in a microwave component?
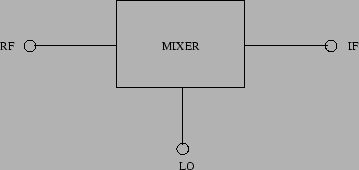
(1.2) Mixer Characteristics:
Mixer is a three terminal device used for translating (converting) a
high frequency signal(RF) to a low frequency signal(IF) using a
locally generated signal(LO). In this part of the experiment we will
measure some important parameters namely conversion loss, RF
leakage and LO leakage of a commercially available mixer (Minicircuits-ZMX7GR).
Figure 4:
 |
Conversion loss is a measure of the efficiency of the mixer in
providing frequency translation between the input RF signal and the
output IF signal. It is defined as follows,
Conversion loss(dB)=
 (1)
(1)
Where  and
and  are the power of IF signal and RF signal
respectively.
are the power of IF signal and RF signal
respectively.
When the LO power level deviates from the recommended level, the
conversion loss will change, finally resulting in nonlinear behavior.
Before starting the experiment try to familiarize the various
terms frequently used in microwave lab by answering the following
questions,
a) Express 0.05mW (milli watts) in dBm.
Ans=---------dBm.
b) Express 1W in dBm.
Ans=-------dBm.
c) An amplifier has a power gain of 14dB, What is the output power
in mW and dBm when the input power of 0.5mW.
Ans=--------mW =----------dBm.
d) When X-dBm power is fed into a coaxial cable the output measured is
Y-dBm, Express the losses in the cable in dB.
Ans=--------dB.
1.2-A) Measure the conversion loss of the given Mixer
(Minicircuits-ZMX7GR) for different LO power.
For doing this experiment, let us use a network analyser (Wiltron
360B) in continues wave mode for RF, a synthesiser for LO and spectrum
analyzer for measuring the power levels.
Since the coaxial cables are highly lossy we have to consider the
losses. For measuring the losses, fix synthesiser power
level to 0dBm. Use coaxial cable to feed this power to a spectrum
analyzer.
Measured power level at the output of coaxial cable ,  ------dBm.
Losses in cable,  =---------dB.
Fix the RF power level of NWA (Network Analyzer) in continues
wave mode (5GHz) at 5dBm. Measure the RF power level at the out put
of the cable () using the spectrum analyzer.
=-------dBm
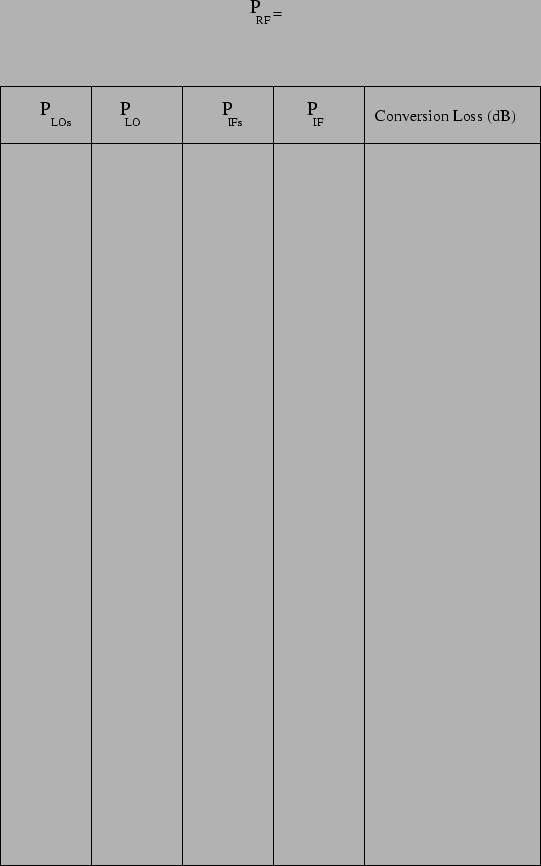
Take the power level as the RF power to mixer, Change the
LO power (at 5.5GHz) at synthesiser ( ) from -15dBm and slowly
vary it to saturation,each time noting the measured IF power level,
) from -15dBm and slowly
vary it to saturation,each time noting the measured IF power level,
 at spectrum analyzer.
From the cable losses we can
calculate the actual LO power level, (
at spectrum analyzer.
From the cable losses we can
calculate the actual LO power level, ( ) and actual IF power
level, (). Finally we can find from the formula given in (1)
the conversion loss in dB. Tabulate the readings in Fig.5. Draw a
graph.
) and actual IF power
level, (). Finally we can find from the formula given in (1)
the conversion loss in dB. Tabulate the readings in Fig.5. Draw a
graph.
Figure 5:
 |
1.2-B) RF and LO leakage into IF can be a serious problem for
mixers, Measure and calculate the actual leakage power after considering the cable losses.
 =---------dBm.
 =---------dBm.
Next: About this document ...
Dhanesh Gopinatha-Kurup
2000-09-08